
Titanic Passenger Dataset:
Machine Learning Classic Challenge
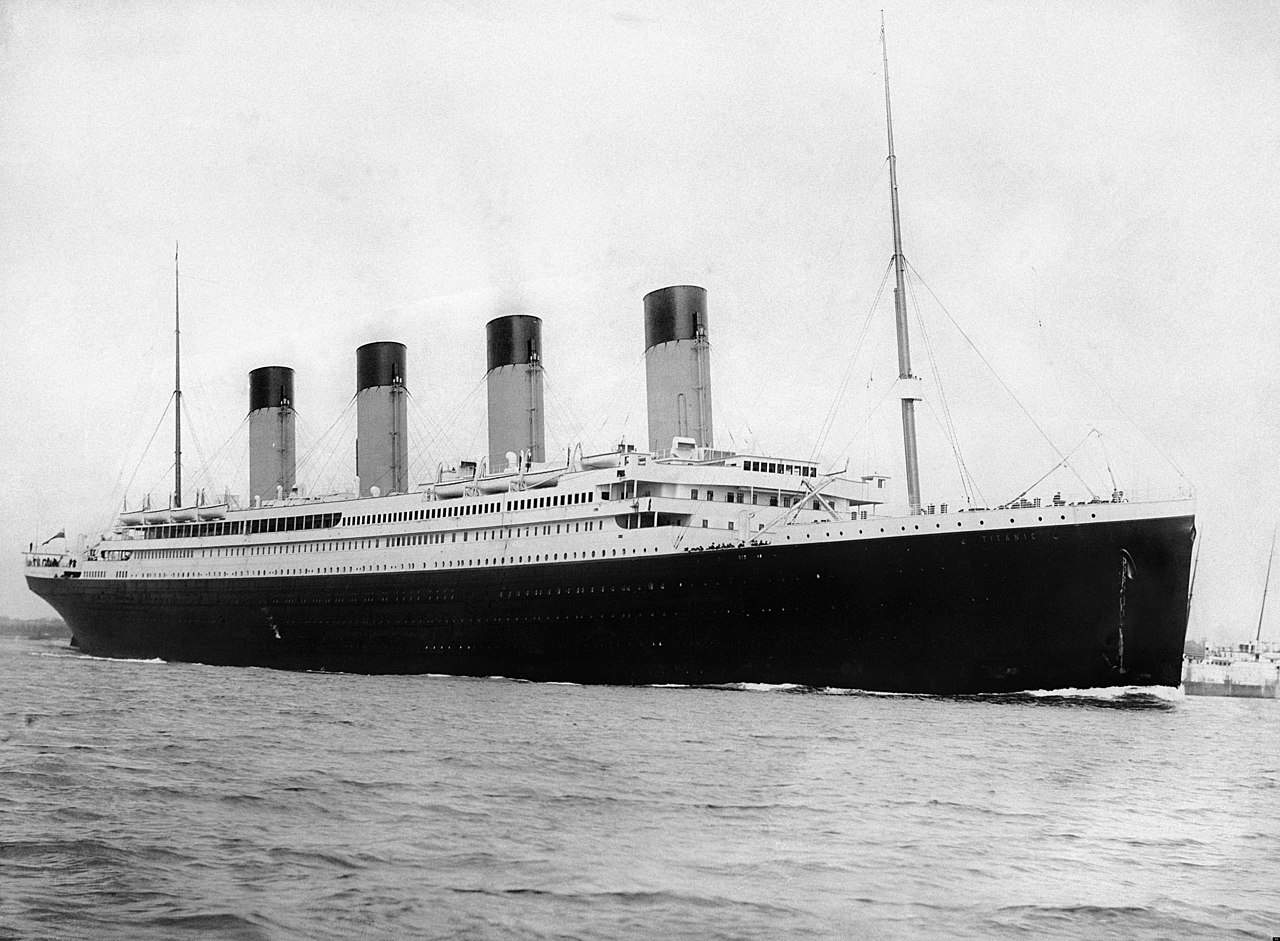
Based on the real passenger data from the 1912 Titanic sinking. 887 samples, 12 features—covering numerical, categorical, and text features, making it an ideal dataset for learning binary classification, feature engineering, and data preprocessing.
Dataset Highlights
The Titanic dataset has good reasons to be the most popular introductory dataset in the global ML community.
Classic Binary Classification
A classic survival prediction binary classification problem with a clear goal—predicting whether passengers survived the sinking, making it an excellent starting point for learning classification algorithms.
Rich Features
Includes numerical, categorical, and text features, covering multidimensional information such as age, fare, gender, and cabin class, suitable for various feature processing methods.
Real Data
Based on real historical data from the Titanic in 1912, each record corresponds to a real passenger, giving deeper meaning to data analysis.
Data Cleaning
Contains missing values (such as age, cabin number), suitable for data preprocessing practice, learning practical skills like filling missing values and handling outliers.
Widely Used
One of the most commonly used introductory datasets in the global ML community, a classic Kaggle competition topic, with a wealth of tutorials and reference solutions.
Compact and Portable
A 44KB CSV file contains all the data, supports quick offline loading, no worries about storage or bandwidth issues, start analyzing anytime, anywhere.
Applicable Scenarios
From classroom exercises to Kaggle competitions - common uses of the Titanic dataset
Survival Prediction
Use algorithms like logistic regression, random forests, and XGBoost to predict passenger survival probabilities, a classic binary classification introductory task
Feature Engineering
Extract titles from names, combine family size, bin ages and fares, practice feature creation and transformation techniques
Data Visualization
Plot charts showing the relationship between survival rates and gender, class, age, intuitively understand data distribution and feature correlation
Machine Learning Teaching
Cover the complete process of data cleaning, feature engineering, model training, and evaluation, suitable for teaching and self-study
Data Preview
Sample examples of the Titanic dataset (CSV format)
Survived,Pclass,Name,Sex,Age,SiblingsSpouses,ParentsChildren,Fare
0,3,Mr. Owen Harris Braund,male,22,1,0,7.25
1,1,Mrs. John Bradley Cumings,female,38,1,0,71.28
1,3,Miss. Laina Heikkinen,female,26,0,0,7.93
1,1,Mrs. Jacques Heath Futrelle,female,35,1,0,53.10
0,3,Mr. William Henry Allen,male,35,0,0,8.05
3 Steps to Get Started Quickly
From browsing to using, it only takes a few minutes
Browse the Dataset
View detailed descriptions, field definitions, and data previews of the Titanic dataset on the Ace Data Cloud platform.
Download the CSV File
One-click download of a 44 KB CSV file to your local machine, no registration, no payment, get it immediately.
Load and Use
Load the data using Python, R, or any data analysis tool, and start training models or creating visualizations.
import pandas as pd
from sklearn.model_selection import train_test_split
from sklearn.ensemble import RandomForestClassifier
from sklearn.metrics import accuracy_score, classification_report
# Load data
df = pd.read_csv("titanic.csv")
# Feature engineering: extract titles, calculate family size
df["Title"] = df["Name"].str.extract(r" ([A-Za-z]+)\.")
df["FamilySize"] = df["SiblingsSpouses"] + df["ParentsChildren"] + 1
# Select features and process
features = ["Pclass", "Sex", "Age", "Fare", "FamilySize"]
df["Sex"] = df["Sex"].map({"male": 0, "female": 1})
df["Age"].fillna(df["Age"].median(), inplace=True)
# Split into training and testing sets
X = df[features]
y = df["Survived"]
X_train, X_test, y_train, y_test = train_test_split(
    X, y, test_size=0.3, random_state=42
)
# Train the random forest classifier
clf = RandomForestClassifier(n_estimators=100, random_state=42)
clf.fit(X_train, y_train)
# Evaluate the model
y_pred = clf.predict(X_test)
print(f"Accuracy: {accuracy_score(y_test, y_pred):.2%}")
print(classification_report(y_test, y_pred, target_names=["Did not survive", "Survived"]))
Start Your Machine Learning Journey
The Titanic dataset is a classic challenge for millions of developers worldwide to learn machine learning. Download for free and start exploring immediately.